Mapping Celestial Terrains, in All Their 3-D Splendor
ALTADENA, California - When space engineers made a map of a planet or a distant moon back in the old days, they made a picture of part of the surface, identified a couple of landmarks and measured the distance between them with a straightedge and a crayon.
“Then you punched the number into the computer and figured out the latitude and longitude,”recalled Robert W.Gaskell, a planet-mapping expert. The result was two-dimensional, with only hints of surface texture or complexity.
No more. With modern computers, digital photography and laser range-finding, scientists today can pinpoint the locations of their spacecraft, picking landing sites and otherwise describing the solar system’s extraterrestrial landscapes.
And nobody does it better than the 63-year-old Dr.Gaskell. With software he developed over a quarter-century , he can process hundreds of images in a few hours, slap them atop one another electronically like coats of paint and produce a topographical map so detailed that you often need a pair of 3-D glasses to appreciate what he has done.
He retired from the NASA Jet Propulsion Laboratory in 2006 so he could make maps full time, and he now works in a computer-filled office at his home in this suburb northeast of Los Angeles.
Dr.Gaskell is now mapping all of Mercury and eight moons of Saturn. He also has a NASA contract to do part of a topographical map of Earth’s Moon, and he is working to refine his model of the near- Earth asteroid Eros. He has made 12,000 overlay“maplets”of Eros from images produced by the NEAR spacecraft at the turn of the century.
In all, NEAR made 160,000 digital images, and“I’m doing 1,000 at a time,”Dr.Gaskell said.
Dr.Gaskell calls what he does “stereophotoclinometry.”Ideally he needs at least three images of the target landscape, usually taken by an orbiting spacecraft or a probe on a flyby to another destination. Only in rare cases can telescope images provide enough detail.
The sun angle must be different for each exposure so each image shows different shadows. By comparing the shadows, the software calculates slopes, which yield the altitudes of target features. The computer solves the equation in three dimensions, producing a patchlike topographical maplet.
The goal is to create a 3-D model of an entire body. A first take can be done quickly, but more images and more maplets produce more overlap, sharpening the topography.
It was in 1989 that Dr.Gaskell got an inkling of what might be possible, using images from the Voyager spacecraft to study Jupiter’s volcanic moon Io. He built his map by comparing the brightness of a feature in different images.“I intuitively knew that different illuminations could give more information,”he said.
“His approach is unique,”said the geophysicist Olivier Barnouin-Jha of the Johns Hopkins University Applied Physics Laboratory, a Gaskell collaborator.“But it’s not quite as nice as a black box. There’s a lot of handholding and agonizing that goes into this.”
스마터리빙
more [ 건강]
[ 건강]이제 혈관 건강도 챙기자!
[현대해운]우리 눈에 보이지 않기 때문에 혈관 건강을 챙기는 것은 결코 쉽지 않은데요. 여러분은 혈관 건강을 유지하기 위해 어떤 노력을 하시나요?
 [ 건강]
[ 건강]내 몸이 건강해지는 과일궁합
 [ 라이프]
벌레야 물럿거라! 천연 해충제 만들기
 [ 건강]
[ 건강]혈압 낮추는데 좋은 식품
[현대해운]혈관 건강은 주로 노화가 진행되면서 지켜야 할 문제라고 인식되어 왔습니다. 최근 생활 패턴과 식생활의 변화로 혈관의 노화 진행이 빨라지고
사람·사람들
more
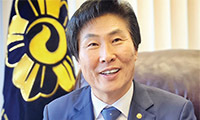
[한인단체 신년 인터뷰] LA 평통 장병우 회장… “본연 역할로 한반도 평화 실질 기여”
민주평화통일자문회의 LA협의회(이하 LA 평통) 장병우 회장은 6일 본보와의 신년 인터뷰에서 붉은 말의 해인 병오년 새해를 맞아 신년 화두로 …

워싱턴주에 첫 한인 시의장
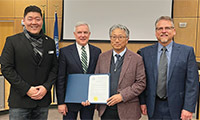
워싱턴주에서 첫 한인 시의회 의장이 탄생했다. 제이슨 문(한국명 문태원) 머킬티오 시의원이 새해 들어 시의장으로 선출되며 또 하나의 중책을 맡…
국회 방문단 대한인국민회 방문
윤후덕·이해식·김한규 의원과 조오섭 국회의장 비서실장 등 10여 명의 한국 국회방문단이 지난 5일 LA를 찾아 로즈데일 묘지와 국민회관 등 미…
[한인단체 신년 인터뷰] 명원식 파바월드 회장… …
“한인 차세대들이 바르게 자랄 수 있는 토대를 만드는 것이 제가 파바월드의 회장으로 존재하는 유일한 이유입니다”한인사회의 대표적 청소년 봉사 …
LA한인회 멘토 프로그램 10일 스티브 강 위원장
LA 한인회(회장 로버트 안)가 한인사회 차세대 인재양성 노력의 하나로 ‘멘토를 만나다’ 프로그램을 정례화해 실시하고 있는 가운데 그 세 번째…
많이 본 기사
- 머스크, 韓인구절벽 또 경고… “북한군 그냥 걸어 넘어오면 돼”
- 구글 공동창업자도 오라클 회장도…탈캘리포니아?
- 덴마크·그린란드, 美 ‘그린란드 회담’ 수락에 “환영”
- 연예계 은퇴합니다..돌연 충격 선언한 조윤우·소희·이태임
- 트럼프, ‘美 베네수 운영 관여 1년 넘나’ 묻자 “훨씬 더 길 것”
- 젤렌스키 “美 우크라 안전보장안, 트럼프 결정만 남아”
- [스키 기고] 초보자의 수난과 고수의 허세
- ICE 요원 총격… 시민권자 여성 사… 4
- “공업용 실리콘을 얼굴에”..故 선풍기 아줌마, 충격적인 성형 부작용[꼬꼬무]
- 내란특검, 尹 구형 숙고 6시간 ‘마라톤 회의’…키는 조은석 손에
- 탁재훈·신정환, 드디어 컨츄리꼬꼬 재회.. “또 잡힌 겁니까?”[노빠꾸]
- 트럼프 관세에 美 무역적자 16년만에 최소…의약품 수입 금감
- 초강경 이민단속, 아시아계도 큰 타격 3
- ‘美 정복’ 손흥민, 케인·메시·음바페와 어깨 나란히... ‘올해의 팀’ 공격수 부문 후보 등극
- 美, 인천에 본부 둔 녹색기후기금 탈퇴… “자금지원 안해”
- ICE Agent Shooting Sparks Outrage: U.S. Citizen Woman Killed
- ‘오타니·야마모토’ 때문에 日 못 뚫는 SF, ‘이정후 파워’로 한국 개척 나선다... 일본도 주목 중
- 케빈 김 주한 미 대사대리 전격 이임
- 유엔기후협약, 美 탈퇴에 “자책골…재가입문 열려있어”
- 초강경 이민단속, 아시안 커뮤니티도 큰 타격
- 이주자 텍사스 몰린다 가주는 유입자 최하위
- ‘데이트 폭력 폭로’ 재키와이, 돌연 입 열었다 “흉기·스토킹 NO”
- 팰팍 타운 77만달러 적자 놓고 정치권‘충돌’
- 李대통령 “에너지 문제로 국제 혼란…에너지대전환 잘 준비해야”
- 美, ‘외국산 드론·부품 수입 금지’ 예외 허용…삼성 제품 포함
- [발언대] L.A. 갈비의 유래
- 軍권력기관 방첩사, 계엄 여파로 49년 만에 역사 속으로
- 브로드웨이 뮤지컬 공연을 반값에…
- LAX 무인열차 6월엔 개통되나
- “모든 소송 철회하고 내분사태 원만히 해결하길”
- 마크롱 “美, 일부 동맹국에 등 돌리고 국제규범서 벗어나”
- “주택 부족, 워싱턴 경제 위험 초래”
- D-SNP 한인 가입자들, 그로서리 혜택 놓친다
- 부고-박철환 씨 별세
- 42억 횡령→징역형 집유 받았는데도..황정음 소속사 여전히 미등록
- 뉴욕 등 5개주 연방아동보육예산 지원 전격 중단
- MD 몽고메리서 음주운전자 140여명 적발
- ‘故안재환과 사별’ 정선희, 재혼 질문에 솔직 답변 “국내에선 의향 없어”
- 제5대 회장에 김길영 회장 연임
- 한인 제이슨 문, 머킬티오 시의장됐다...5일 첫 회의 주재한 가운데 ‘한인의 날’지지 선언문 채택
- 韓 여야, 이혜훈 청문회 19일 하루 잠정 합의… “충분히 질의”
- 형제교회 올해도 1만달러 ...꿈나눔북클럽 2,000달러, 시애틀진보연대 500달러
- 2026년은?
- [신년 집중기획/ 변모하는 한인타운] K-컬처 중심으로… 면모·체질 ‘업그레이드’ 원년
- ‘연방 하원 민주·상원 공화’가능성 커
- 가주 등 5개주 연방 아동보육 예산 전격 동결
- LA 한인회, 새해 맞아 양로병원 어르신들께 ‘새배’
- [독자 투고] 땅 끝 마을 파타고니아… 2
- 아펜젤러 한국선교 140주년 기념 미주 순회공연
- ‘맥립’에 갈비고기 없다 맥도널드 허위광고 소송
1/5지식톡

-
 미 육군 사관학교 West Poin…
0
미 육군 사관학교 West Poin…
0https://youtu.be/SxD8cEhNV6Q연락처:wpkapca@gmail.comJohn Choi: 714-716-6414West Point 합격증을 받으셨나요?미 육군사관학교 West Point 학부모 모…
-
 ☝️해외에서도 가능한 한국어 선생님…
0
☝️해외에서도 가능한 한국어 선생님…
0이 영상 하나면 충분합니다!♥️상담신청문의♥️☝️ 문의 폭주로 '선착순 상담'만 진행합니다.☎️ : 02-6213-9094✨카카오톡ID : @GOODEDU77 (@골뱅이 꼭 붙여주셔야합니다…
-
 테슬라 자동차 시트커버 장착
0
테슬라 자동차 시트커버 장착
0테슬라 시트커버, 사놓고 아직 못 씌우셨죠?장착이 생각보다 쉽지 않습니다.20년 경력 전문가에게 맡기세요 — 깔끔하고 딱 맞게 장착해드립니다!장착비용:앞좌석: $40뒷좌석: $60앞·뒷좌석 …
-
 식당용 부탄가스
0
식당용 부탄가스
0식당용 부탄가스 홀세일 합니다 로스앤젤레스 다운타운 픽업 가능 안녕 하세요?강아지 & 고양이 모든 애완동물 / 반려동물 식품 & 모든 애완동물/반려동물 관련 제품들 전문적으로 홀세일/취급하는 회사 입니다 100% …
-
 ACSL 국제 컴퓨터 과학 대회, …
0
ACSL 국제 컴퓨터 과학 대회, …
0웹사이트 : www.eduspot.co.kr 카카오톡 상담하기 : https://pf.kakao.com/_BEQWxb블로그 : https://blog.naver.com/eduspotmain안녕하세요, 에듀스팟입니다…
케이타운 1번가
오피니언
 이상희 UC 리버사이드 교수 인류학
 오렌지 상자와 함께하는 2026년
 오세정 서울대 물리천문학부 명예교수·전 총장
 [오세정 칼럼] 병오년 새해, 한국의 과제
 존 안 / LA 거주
 [독자 투고] 땅 끝 마을 파타고니아 여행 유감
 이리나 수필가
 [윌셔에서] 레디 코어(Ready Core)의 해를 맞으며
 이영창 / 한국일보 논설위원
 [지평선] 67년생 현역 축구선수 미우라

[왈가 왈부] “이혜훈 청문회까지 지켜봐야”… 국민 눈높이에 맞나요
 정숙희 논설위원
케네디에 관한 네 개의 이야기
 마크 A. 시쎈 / 워싱턴포스트 칼럼니스트
 [마크 A. 시쎈 칼럼] 트럼프의 20가지 업적
 김동찬 시민참여센터 대표
 [미국은 지금] 2026년 ‘손님’ 의식 버리고 ‘주인’ 입장을
1/3지사별 뉴스

팰팍 타운 77만달러 적자 놓고 정치권‘충돌’
뉴저지 팰리세이즈팍 타운정부가 지난해 77만5,000달러 재정적자가 발생한 것을 두고 정치권이 강하게 충돌하면서 지역 한인사회가 술렁이고 있다…
뉴욕 등 5개주 연방아동보육예산 지원 전격 중단

‘연방 하원 민주·상원 공화’가능성 커
올해 11월3일 미 전역에서 중간선거가 실시된다. 이번 선거에서는 연방 하원 전체 435석과 함께 연방 상원 100석 가운데 35석을 새로 선…
“주택 부족, 워싱턴 경제 위험 초래”

베네수 이어 그린란드…트럼프, 2년차 벽두부터 美우선주의 거친 질주
2026년 새해 벽두부터 도널드 트럼프 대통령의 행보가 심상치 않다.집권 2기 2년차를 맞아 자신과 지지층의 이념이라 할 ‘미국 우선주의’ 구…
중부 캘리포니아 ‘한인 이민사’ 나왔다


.png)


댓글 안에 당신의 성숙함도 담아 주세요.
'오늘의 한마디'는 기사에 대하여 자신의 생각을 말하고 남의 생각을 들으며 서로 다양한 의견을 나누는 공간입니다. 그러나 간혹 불건전한 내용을 올리시는 분들이 계셔서 건전한 인터넷문화 정착을 위해 아래와 같은 운영원칙을 적용합니다.
자체 모니터링을 통해 아래에 해당하는 내용이 포함된 댓글이 발견되면 예고없이 삭제 조치를 하겠습니다.
불건전한 댓글을 올리거나, 이름에 비속어 및 상대방의 불쾌감을 주는 단어를 사용, 유명인 또는 특정 일반인을 사칭하는 경우 이용에 대한 차단 제재를 받을 수 있습니다. 차단될 경우, 일주일간 댓글을 달수 없게 됩니다.
명예훼손, 개인정보 유출, 욕설 등 법률에 위반되는 댓글은 관계 법령에 의거 민형사상 처벌을 받을 수 있으니 이용에 주의를 부탁드립니다.
Close
x